How to measure your sites speed
| “Asking users to wait is like asking them to leave” | A slow website creates a poor experience. Users with a broadband connection expect websites to deliver instant information, and asking users to wait is like asking them to leave. A fast website encourages people to keep using the site you spent weeks or months creating for them. Is your website fast or slow? In this paper we introduce straightforward techniques for measuring the speed of your site’s web pages using a Windows-based PC. We give recommendations for page load goals and help with diagnosing the cause of slow web pages. |
How do you measure page load times? Two common mistakes
The only meaningful measurement of a page’s speed is “how fast a page loads in a customer’s web browser”. Because there is no way to measure the speed of an entire site, you should measure the speed one page at a time. The homepage is a good place to start.
| “Measure page load time, not server processing time” | There are two common mistakes people make when measuring page load times:
|
The only accurate measurement is to measure how long the user’s browser takes to load a page from their location.
How long should your customers wait?
| “Thirty-three percent of consumers shopping via a broadband connection will wait no more than four seconds for a Web page to render” | There is growing research to connect slow page load times with low customer satisfaction and high site abandonment. For happy customers, set page load goals, measure against these goals and take action where necessary. The following recommendations are based on accredited industry research, and are for an average user with a regular Windows-based PC, 1Mb broadband connection and Microsoft Internet Explorer or Mozilla Firefox.
|
Measure your site’s speed
The only meaningful measurement of a page’s speed is how fast a page loads in a customer’s web browser from their location – network latency plays a huge role in page load times, and measuring speed from a PC located close to the web server does not capture the real-world travel time over the internet.
We recommend using one of two methods for measuring a page’s speed:
a) If the page is an internet-facing public page, use the AOL Page Test to measure page load times from Dulles, VA, USA. This is a free website where you enter your site’s URL, and the server loads the page with Internet Explorer and displays the results after a few seconds.
If the page is an intranet or non-public internet page, use either Microsoft Internet Explorer or Mozilla Firefox to measure the local page load time and apply a multiplier to estimate the load time for users accessing the site remotely.
Server-based testing: AOL PageTest
The AOL PageTest is a free over-the-web tool for performance testing a page from Dulles, VA, USA.
| To use the AOL PageTest: 1. Go to www.webpagetest.org 2. Type in your site address, e.g. www.aol.com, then click the Submit button. 3. The page will refresh a few times then show you the cold and warm load times for the page with a waterfall diagram. The AOL page test is more accurate than most web-based tools a real browser to measure load times – many other web-based tools approximate load times by parsing HTML files. | ![clip_image002[8] clip_image002[8]](http://lh4.ggpht.com/pieter.jvv/SL9IUqnaKQI/AAAAAAAAALI/7QfCJuNg1w0/clip_image002%5B8%5D_thumb%5B1%5D.jpg?imgmax=800) |
Client based testing: httpWatch and Firebug
Neither Microsoft Internet Explorer or Mozilla Firefox have capabilities for measuring a page’s speed, but there are add-ons available for each that produce waterfall diagrams and page load diagrams. We recommend using either tool to measure page load times from a client:| Microsoft Internet Explorer versions 6,7 or 8 | Mozilla Firefox versions 2,3 |
![clip_image002[10] clip_image002[10]](http://lh3.ggpht.com/pieter.jvv/SL9IXEVf5mI/AAAAAAAAALQ/xN4lPB6ZTcg/clip_image002%5B10%5D_thumb%5B1%5D.jpg?imgmax=800) | ![clip_image002[12] clip_image002[12]](http://lh5.ggpht.com/pieter.jvv/SL9IZM9tTeI/AAAAAAAAALY/N5fHiRiZvMU/clip_image002%5B12%5D_thumb%5B1%5D.jpg?imgmax=800) |
Because these tools give you the timings from your local machine, you need to apply a multiplier to estimate the effect of network latency for remote users:
1. Use Microsoft Internet Explorer with httpWatch or Mozilla Firefox with Firebug to measure the page load time from “onsite” – a workstation physically close to the web server. This is your local page load time.
2. Apply the following formula to estimate the effect of network latency for a user located with a 1Mb connection located within 1,000 miles of the server:
For example, suppose you have a 0.5 second local load time, and the page has 20 requests and is 350KB in size, the page load time would be:
this equals 3.439394 seconds.
Analyze your page load time
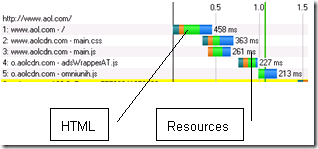
If your page load time doesn’t meet an acceptable goal, you can quickly make an analysis using the page load waterfall diagram.
If the HTML page takes a long time to process, tuning the application, optimizing database queries and adding hardware will improve the page load time. If the JavaScript, CSS, image resources take a long time to load, applying frontend optimization techniques will reduce the page load time.
Typically, backend processing contributes 10% to the page load time, and frontend processing contributes 90% to page load time.
If you need to tune frontend processing, look at the Runtime Page Optimizer – a software component that automates many of Yahoo’s “best practices for speeding up websites”, increasing the speed a page loads by combining, compressing and caching JavaScript, CSS and images. Now available for ASP.NET and SharePoint sites. See www.getrpo.com for more information.
[1]http://www.akamai.com/dl/reports/Site_Abandonment_Final_Report.pdf
[2] http://www.keynote.com/docs/whitepapers/zona_need_for_speed.pdf
This article is brought to you by the fantastic people at RPO.
![clip_image002[6] clip_image002[6]](http://lh6.ggpht.com/pieter.jvv/SL9IQ2q7ulI/AAAAAAAAALA/b1EWqZz1aag/clip_image002%5B6%5D_thumb%5B1%5D.jpg?imgmax=800)

Comments